You Can Find Updated Article Here
Beginning of Analysis
You Can Find Updated Article Here
Every investor is concerned about the return on investment. The primary question of any investor remains the same, has my investment portfolio generated more return than inflation or not? Inflation is a measure of is an increase in the level of prices of the goods and services that households buy.
Here in this article, we will try to answer this question. We will compare inflation in India with the return on investment of different asset classes like gold, silver, share market and real estate.
Inflation/ CPI
Let’s start with inflation. Inflation in India is generally measured by the Consumer Price Index. There are other measures to calculate inflation like the Wholesale Price Index (WPI), the price index for industrial workers, e.t.c.
Chart 1 shows the level of CPI in India in the last five years. (October 2015 to September 2020).
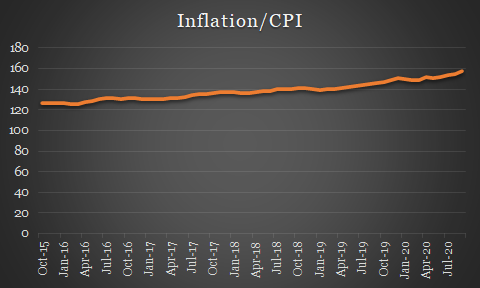
In October 2015 CPI was 126.1 points and in September 2020 it was 157.6 points. The annual rate of inflation in this period comes out at 4.56%. Table 1 shows the inflation rate for different periods. In September 2020 the rate of inflation was 7.07%.
| Time | YTD | 1 Year | 3 Year | 5 Year |
|---|---|---|---|---|
| CPI | 4.79% | 7.07% | 5.01% | 4.56% |
Summary of Investment Returns
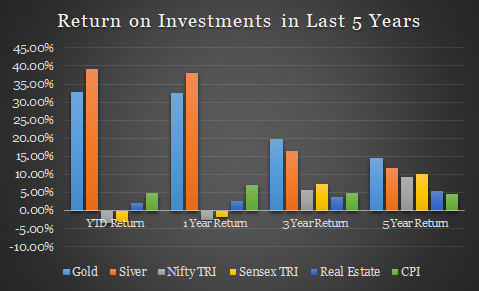
Chart 2 shows the summary performance of return on investment for different asset classes. Based on chart 2 one can easily say that gold and silver have given maximum return in the past 5 years.
Chart 2: Summary of Investment Returns
Return from Gold and Silver
Chart 3: Return from Gold and Silver
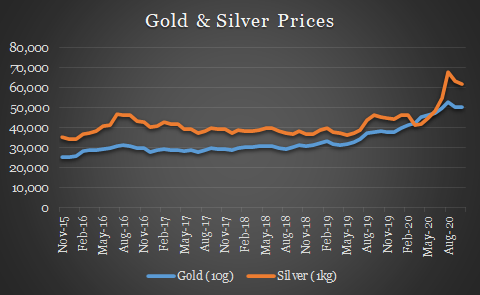
Gold and Silver in the last five years have given the maximum return in all asset classes considered here. One year return of gold is 32.6% and for the silver, one year return is 38%. The compounded annual rate return in five years for gold is 14.53% and for silver 11.90%.
| Time | YTD | 1 Year | 3 Year | 5 Year |
|---|---|---|---|---|
| Gold | 32.71% | 32.60% | 19.80% | 14.53% |
| Silver | 39.09% | 37.97% | 16.38% | 11.90% |
Return from Equity Investment
To calculate equity returns one can choose from hundreds of indexes. We selected headline indexes NIFTY Total Return Index (TRI) and Sensex Total Return Index.
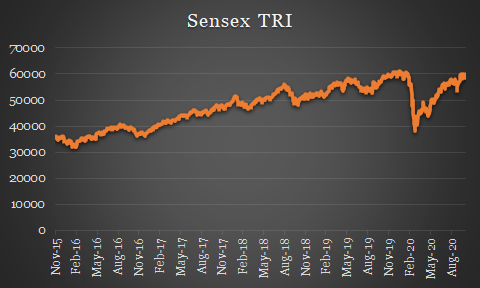
Equity investments have not generated great returns in the last one year. NIFTY TRI (-2.45%), as well as Sensex TRI (-1.73%) both, have given negative returns in one year period. However, the five years the annualized rate of return of NIFTY TRI is 9.34% and for Sensex TRI 10.04%. The Five years return is well above inflation (4.56%).
| Time | YTD | 1 Year | 3 Year | 5 Year |
|---|---|---|---|---|
| NIFTY TRI | -3.35% | -2.45% | 5.72% | 9.34% |
| Sensex TRI | -2.83% | -1.73% | 7.38% | 10.04% |
Return from Real Estate
Real estate is a highly illiquid investment instrument. The data for its prices are not easily available. Each city will have its price dynamics. Prices within a city changes based on different factors. In the same locality, real estate prices on one road will be different from another road. I have used data of all India residential property index from the Bank of International Settlements (BIS).
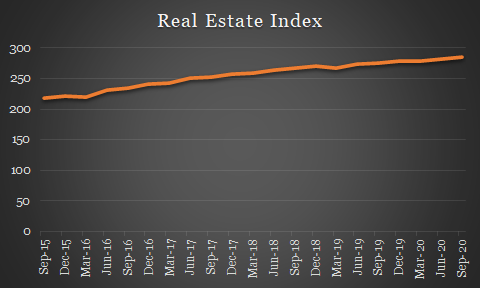
Based on data presented in table 4, it can be said the real estate as an investment asset has performed the worst. The five-year compounded annual growth rate (CAGR) is only 5.3%. The large prices size not everyone can afford to invest in real estate. It is out of reach for most people as an investment.
| Time | YTD | 1 Year | 3 Year | 5 Year |
|---|---|---|---|---|
| Real Estate Index | 2.16% | 2.78% | 3.76% | 5.30% |
Fixed Deposit Interest Rate
Last but not least, the return from fixed deposits. Table 5 shows the interest rate on deposit. The interest rate on deposits has decreased in the last five years. Five years ago the interest rate on five-year deposit was 7.3% but now it has decreased to only 5.5% in the financial year 2020-21.
If we compare five year FD rate of 2015-16 to five-year inflation rate, the real rate of return comes at 2.75%. The real rate of return is very high given almost zero risks associated with fixed deposits. The high real interest rate in the last five years is the primary reason for the slow down in the Indian economy.
| Deposit Time | 2020-21 | 2019-20 | 2018-19 | 2017-18 | 2016-17 | 2015-16 |
|---|---|---|---|---|---|---|
| 3-5 Years | 5.35% | 6.4% | 7.25% | 6.7% | 6.9% | 7.5% |
| 5 + Years | 5.5% | 6.4% | 7.25% | 6.75% | 6.75% | 7.3% |
Conclusion
Most of the investment has given returns that are more than inflation in the last five years. An analysis of short-period distorts the picture. Real estate is the worst-performing investment. Fixed deposits are also losing out to inflation now.