Published on: 02 Feb, 2021 05:53
Beginning of Analysis
The Economic Survey presented before the budget contains a rich set of data that shine a light on the economic condition of India. The headline always end-up talking about GDP and GDP growth rate. GDP number shows a Macro picture of the economy. Our series India in Charts will look at the micro-level of the economy and try to analyze it.India In Charts Economic Survey 2021: Electricity
In the first part, we will discuss electricity installed capacity and generation in India.
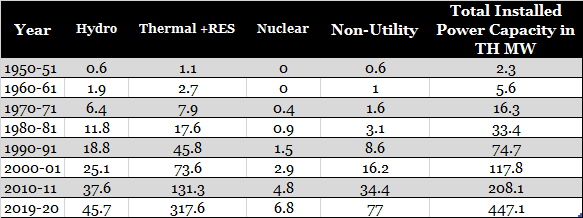
Table 1: Installed electricity capacity in India by Type
Table 2: Total Electricity Generation in India by Type

- In 1950-51 total installed electricity capacity in India was 2300 MW and total generation was 6.6 billion KWH.
- In 2019-20 total installed electricity capacity in India was 447,000 MW and generation was close to 1,600 billion KWH.
Chart 1: Installed Power Capacity Share
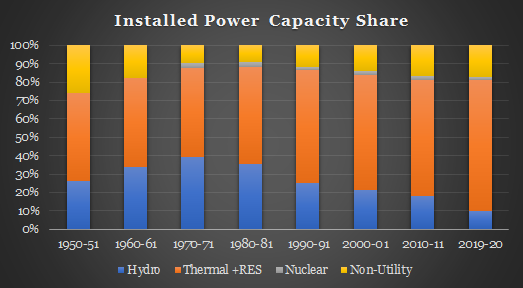
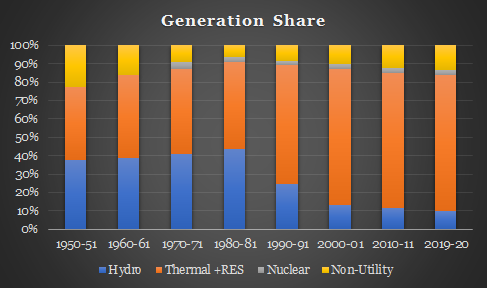
Chart 1: Installed Generation Share
- 25% installed capacity was hydro in 1950 now its share has fallen to 10%. Till 1970-71 hydro share kept on increasing in total installed capacity but from 1980-81 onward share of hydro started decreasing.
- Whereas the share of hydro in installed capacity was only 25% but generation it was close to 40% in 1950-51, the same story continues till 1980-81 hydro had a lower share in installed capacity but higher share in a generation.
- Now installed capacity and generation of hydroelectricity is almost identical.
This was charts related to electricity. Next week, we will show charts related to per capita income in India and the world.